 Photography by Brian Nguyen
Area 1 for this assignment is focused on the Greater Toronto Area, which is located in Southern Ontario, Canada. Global locator maps for this area are provided further down the webpage.
Obtaining Images
Relatively high resolution imagery along with vegetation analysis was of interest to me. This led me to seek out SPOT 5 satellite data, which could be found at GeoBase. GeoBase has a "graphical search" interface which aids in the process of searching for data sets. The Greater Toronto Area was found in region 30M under S5_07927_4340_20070811 which can be interpreted as the corresponding SPOT 5 coverage tile in 2007/08/11. The entirety of the Greater Toronto Area was within the data set which was convenient.
The data set was downloaded via ftp in the form of a compressed .zip file which contained .tif files for bands 1 to 4 derived from the SPOT 5 satellite sensors. These bands will be discussed in further detail further down the webpage. These files were then imported into PCI Geomatica for further analysis and transferred into a single .pix file for easier manipulation.
Global locator maps for geographical context:

Global Locator map of the Greater Toronto Area, which is highlighted within the yellow box. Imagery provided by ESRI Map Services (2009). An interactive Google map is found below:
 SPOT 5 spectral band and spatial resolution chart. Click image for source.
Metadata
The SPOT 5 satellite can provide data in the form of 4 bands with the addition of a panchromatic data set. The 4 different bands cover the green, red, near infrared (NIR) and mid infrared (MIR) of the electromagnetic spectrum, as seen in the chart to the left. The resolution of the green, red and NIR bands are 10m per pixel while the MIR band has a resolution of 20m. The panchromatic data set contains spatial resolutions from 2.5 or 5m. (Astrium Geo, 2014). However only bands 1-4 were utilized for this assignment. The high resolution red and NIR bands allow for good vegetation cover analysis as many vegetation index calculations utilize these two bands.
The radiometric resolution of SPOT 5 data is in 8-bit format with values ranging from 0 to 255, as we shall see in the resulting histograms further down this webpage. Additionally, when examined through PCI Geomatica we can see that there are 3840 columns and 3730 rows of pixels in the provided data sets, however some of these pixels are merely darkened background pixels with a value of 0 across all spectral bands. According to the provided metadata (GeoBase, 2014), the date the data was recorded was August 11, 2007, although it was not published until March 11 of 2008. The bounding latitude and longitude coordinates are as follows:
West Bounding Coordinate:-79.932686
East Bounding Coordinate:-78.971634
North Bounding Coordinate:44.012596
South Bounding Coordinate:43.334194
Source: Metadata was taken directly from the dataset found at GeoBase (2014) and Astrium Geo (2014).
See bottom of page for references.
The images produced from the data are shown directly below
Generated Views of the Greater Toronto Area (Derived from Spot 5):
View 1:

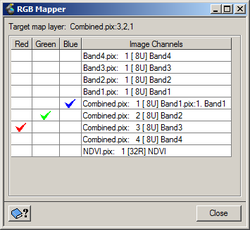
The first view presented is a false colour (also known as pseudocolour) representation of the Greater Toronto Area. This false colour map in particular allows us to visualize areas that reflect or emit various levels of near infrared. The brighter the red of an area, the more near infrared that area radiates. This is achieved by setting the near infrared, red and green bands to the red, green and blue channels, respectively. The RGB mapper was used within PCI Geomatica to accomplish this task, as seen in the image to the right. Histograms of the SPOT 5 bands are found on the bottom section of this webpage.
Qualitative Description
As we can see in the produced map above, the false colour imagery allows us to see that areas with vegetation seem to reflect high amounts of near infrared than anywhere else. One can clearly see vegetation corridors that follow along the city's major rivers (e.g. Humber river). Vegetated areas on the island are also apparent, along with agricultural related areas to the north. This map also allows one to see where the heavily developed urban areas are as well, as they typically exhibit very low levels of near infrared, if any at all. One can easily delineate urban areas such as the downtown core, the industrialized zones of the west and even prominent streets such as Yonge street. They are shown as a cyan type colour, as they reflect some levels of red or green in the electromagnetic spectrum. Some areas can also be seen with a yellow tinge on the map, these may be areas with vegetation experiencing low productivity levels due to various reasons such as harvesting. Such data could be used for various NIR related research, whether it is radiation or absorption. False colour maps are important because they allow humans (with their limited sensory abilities) to visualize electromagnetic ranges that would otherwise be invisible. Utilizing such techniques for urban areas would be beneficial as it could assist in urban planning.
View 2:

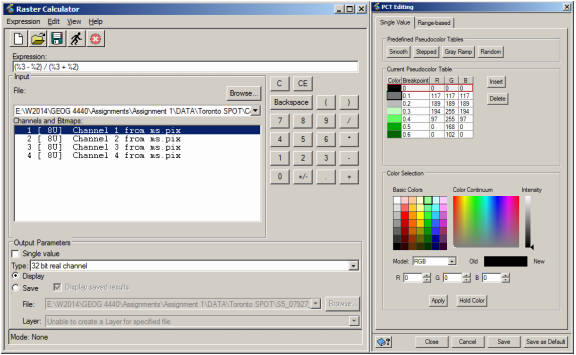
The second view presented for the Greater Toronto Area is a normalized difference vegetation index map. This map is intended to show chlorophyll productivity on a scale of 0 to 1, with 1 being the highest. This is achieved by utilizing the NIR and red spectral bands along with the knowledge that chlorophyll typically exhibits high amounts of NIR (as seen in the previous map view) and low amounts of red.
The NDVI formula used is as follows:
NDVI value = (NIR - R) / (NIR + R)
Where R is red.
This formula is utilized within the raster calculator tool (ensuring 32 bit real output) in PCI Geomatica and the resulting values are given colour codes (in this case a colour ramp of blacks, greys and greens depending on chlorophyll potential) as shown in the images to the left. The darker the green displayed, the higher levels of potential chlorophyll are in the area. In this case, no significant values over 0.5 were found and so the legend was adjusted accordingly as to not skew the data. Histograms of the SPOT 5 bands are found on the bottom section of this webpage.
Qualitative Description
The concentration of this map is chlorophyll levels which is indicative of surface covers such as standing vegetation or algae. One can observe vegetation appearing strongly within the city's parks, along the city's major rivers (e.g. The Don River), along the eastern shoreline and also among the rural/agricultural areas to the north of the city. One is even able to delineate different plots of agricultural land in the north as each patch of farmland that may be used differently exhibit homogeneous NDVI levels but differ from one another, resulting in distinct boundaries. We can also determine that there were no significant levels of algae along the shoreline of the Greater Toronto Area in Lake Ontario during the capture of this data. This means that there was no significant eutrophication events in the area during August 11, 2007. Such data could assist in vegetation monitoring or eutrophication research. This is very important because urban planners or decision makers may want to keep track of their tree stock or be aware of potential pollutants in the nearby lake, which could affect many people In addition, we can see the "shadows" of the heavily urbanized areas on the map, which show up as dark grey or blacks, due to the very low amounts of vegetation being detected in those areas.
Image Statistics and Histograms
Histograms of the 4 SPOT 5 bands are shown below in order, that is Band 1, 2, 3 and 4. A common trend between all 4 bands is that there appear to be one or two peaks at lower levels of brightness which slope downward sharply until it slowly increases as the brightness values increase creating a final peak which decreases gradually as brightness levels continue to increase. The most common value for all 4 bands is the value 0, meaning no radiation detected. This may be attributed to the empty border surrounding the data set (shown as black and carrying 0 for all values). We can see that the green band (band 1) has the bulk of its values generally shifted to the right, which are higher brightness values, when compared to the red band (band 2). This would mean that there are significantly more greens visible in the Greater Toronto Area by satellite than there are reds. The mid infrared band (band 4) also appears to be more evenly spread out than the other bands. This shows that the Greater Toronto Area consists of land cover types that exhibit a wide range of mid infrared levels.
Histograms of the 4 SPOT 5 bands are shown below in order, that is Band 1, 2, 3 and 4. A common trend between all 4 bands is that there appear to be one or two peaks at lower levels of brightness which slope downward sharply until it slowly increases as the brightness values increase creating a final peak which decreases gradually as brightness levels continue to increase. The most common value for all 4 bands is the value 0, meaning no radiation detected. This may be attributed to the empty border surrounding the data set (shown as black and carrying 0 for all values). We can see that the green band (band 1) has the bulk of its values generally shifted to the right, which are higher brightness values, when compared to the red band (band 2). This would mean that there are significantly more greens visible in the Greater Toronto Area by satellite than there are reds. The mid infrared band (band 4) also appears to be more evenly spread out than the other bands. This shows that the Greater Toronto Area consists of land cover types that exhibit a wide range of mid infrared levels.

Band 1
(Green)
Mode: 0
Median: 95
Mean: 93.3524
Standard deviation: 42.7778
(Green)
Mode: 0
Median: 95
Mean: 93.3524
Standard deviation: 42.7778

Band 2
(Red)
Mode: 0
Median: 59
Mean: 62.6773
Standard Deviation: 39.0991
(Red)
Mode: 0
Median: 59
Mean: 62.6773
Standard Deviation: 39.0991

Band 3
(Near Infrared)
Mode: 0
Median 58
Mean: 49.036
Standard Deviation: 36.2139
(Near Infrared)
Mode: 0
Median 58
Mean: 49.036
Standard Deviation: 36.2139

Band 4
(Mid Infrared)
Mode: 0
Median: 93
Mean: 77.9867
Standard Deviation: 60.1348
(Mid Infrared)
Mode: 0
Median: 93
Mean: 77.9867
Standard Deviation: 60.1348
References:
Astrium Geo. (2014). SPOT Images: Resolution and Spectral Bands. Retrieved from http://www.astrium-geo.com/en/194-resolution-and-spectral-bands on Jan 16/2014
GeoBase. (2014). Satellite Imagery: Data Selection. Retrieved from
http://www.geobase.ca/geobase/en/browse.do?produit=imr&decoupage=image&map=030M on Jan 16/2014
Brian Nguyen
209211822
GEOG 4440
Lab: 001
TA: Marzena Marosz-Wantuch
Prof: Dr. Tarmo Remmel
